Simulazione del lancio di due dadi (come somma degli esiti di due dadi singoli)
import random

LANCI=50

def dado(): return random.randint(1,6)

for i in range(LANCI):
   dado1=dado()
   dado2=dado()
   esito=dado1+dado2
   print(esito, end=' ')
Frequenze
Conteggio delle uscite e calcolo finale delle frequenze assolute e relative
import random

LANCI=10000

def dado(): return random.randint(1,6)

#          1  2  3  4  5  6  7  8  9 10 11 12
CONTO=[ 0, 0, 0, 0, 0, 0, 0, 0, 0, 0, 0, 0, 0]
for i in range(LANCI):
    dado1=dado()
    dado2=dado()
    esito=dado1+dado2
    CONTO[esito] += 1

for f in range(2,13):
    print("%2d: %4d %5.2f%%" %(f, CONTO[f], 100*CONTO[f]/LANCI))
matplotlib
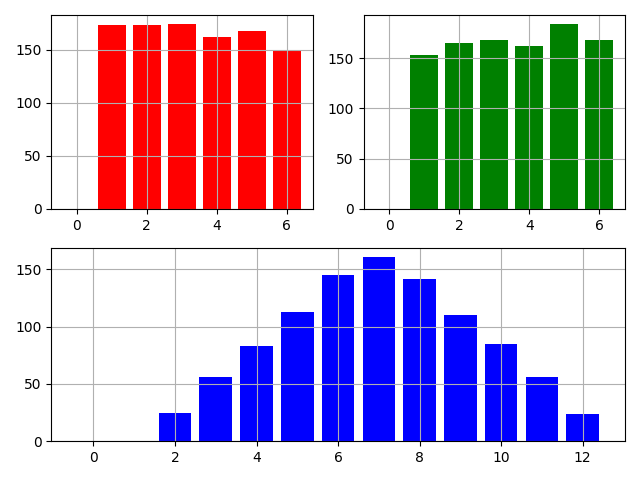
Le frequenze assolute degli esiti dei due dadi e delle loro somme
import matplotlib.pyplot   as plt
import matplotlib.gridspec as gridspec
import random

LANCI=1000

DADO1= 7*[0]
DADO2= 7*[0]
ESITI=13*[0]

def dado(): return random.randint(1,6)

for i in range(LANCI):
    dado1=dado()     ; DADO1[dado1] += 1
    dado2=dado()     ; DADO2[dado2] += 1
    esito=dado1+dado2; ESITI[esito] += 1

print("DADO 1", DADO1)
print("DADO 2", DADO2)
print("DADI  ", ESITI)

fig=plt.figure(tight_layout=True)
gs =gridspec.GridSpec(2, 2)

ax=fig.add_subplot(gs[0, 0]); ax.bar(range(7) , DADO1, color="red"  ); ax.grid()
ax=fig.add_subplot(gs[0, 1]); ax.bar(range(7) , DADO2, color="green"); ax.grid()
ax=fig.add_subplot(gs[1, :]); ax.bar(range(13), ESITI, color="blue" ); ax.grid()

plt.show()