Simulazione del lancio di 3 dadi (come somma degli esiti di 3 dadi singoli)
import random

def dado(): return random.randint(1,6)

LANCI=10
for i in range(LANCI):
    dado1=dado()
    dado2=dado()
    dado3=dado()
    esito=d1+d2+d3
    print(dado1, dado2, dado3, esito)
Frequenze
Conteggio delle uscite e calcolo finale delle frequenze assolute e relative
import random

def dado(): return random.randint(1,6)

LANCI =   1000
DADO1 =  7*[0]
DADO2 =  7*[0]
DADO3 =  7*[0]
ESITI = 19*[0]
for i in range(LANCI):
    dado1=dado()              ; DADO1[dado1] += 1
    dado2=dado()              ; DADO2[dado2] += 1
    dado3=dado()              ; DADO3[dado3] += 1
    esito=esito1+esito2+esito3; ESITI[esito] += 1

print("Dado 1:", DADO1)
print("Dado 2:", DADO2)
print("Dado 3:", DADO3)
print("3 DADI:", ESITI)
matplotlib
import matplotlib.pyplot as plt
import matplotlib.gridspec as gridspec
import random
def dado(): return random.randint(1,6)
LANCI = 1000
DADO1 = 7*[0]
DADO2 = 7*[0]
DADO3 = 7*[0]
ESITI = 19*[0]
for i in range(LANCI):
dado1=dado() ; DADO1[dado1] += 1
dado2=dado() ; DADO2[dado2] += 1
dado3=dado() ; DADO3[dado3] += 1
esito=esito1+esito2+esito3; ESITI[esito] += 1
print("Dado 1:", DADO1)
print("Dado 2:", DADO2)
print("Dado 3:", DADO3)
print("3 DADI:", ESITI)
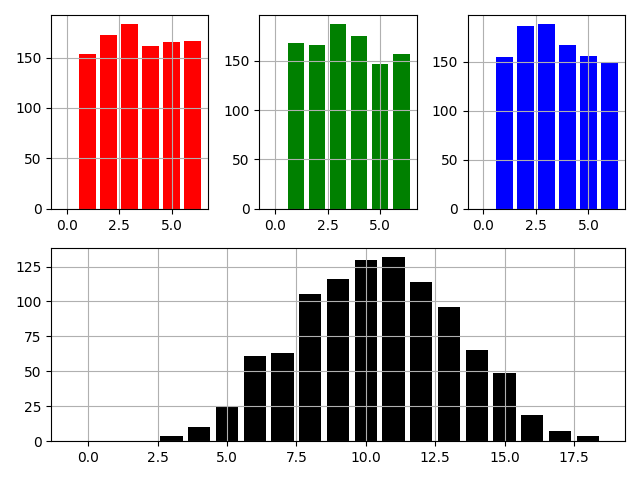
fig=plt.figure(tight_layout=True)
gs =gridspec.GridSpec(2, 3)
ax=fig.add_subplot(gs[0, 0]); ax.bar(range( 7), DADO1, color="red" ); ax.grid()
ax=fig.add_subplot(gs[0, 1]); ax.bar(range( 7), DADO2, color="green"); ax.grid()
ax=fig.add_subplot(gs[0, 2]); ax.bar(range( 7), DADO3, color="blue" ); ax.grid()
ax=fig.add_subplot(gs[1, :]); ax.bar(range(19), ESITI, color="black"); ax.grid()
plt.show()