Il programma GraphTest illustra alcune potenzialità del modulo
from vpython import *
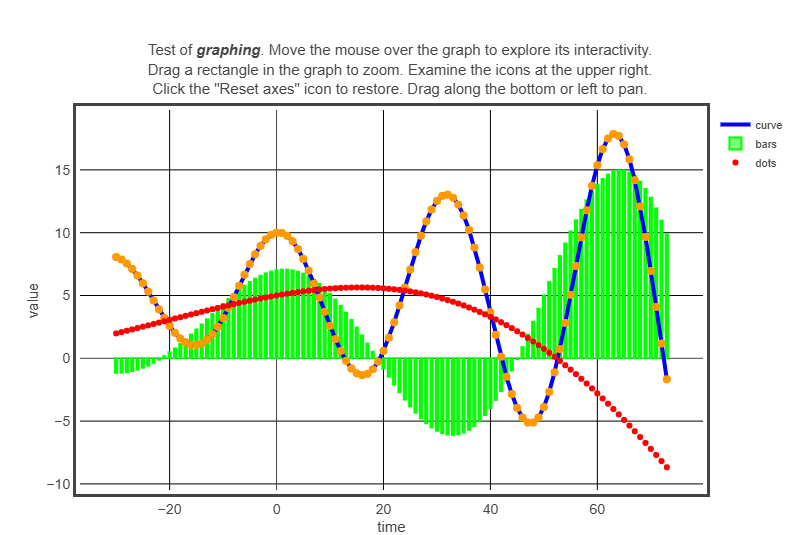
s = 'Test of <b><i>graphing</i></b>. Move the mouse over the graph to explore its interactivity.'
s += '<br>Drag a rectangle in the graph to zoom. Examine the icons at the upper right.'
s += '<br>Click the "Reset axes" icon to restore. Drag along the bottom or left to pan.'
oscillation = graph(title=s, xtitle='time', ytitle='value', fast=False, width=800)
grafico1 = gcurve(color=color.blue, width=4, label='curve',
markers=True, marker_color=color.orange)
grafico2 = gvbars(color=color.green, delta=0.4, label='bars')
grafico3 = gdots (color=color.red, size=6, label='dots')
def f1(t): return 5.0+5.0*cos(-0.2 *t)*exp(0.015*t)
def f2(t): return 2.0+5.0*cos(-0.1 *t)*exp(0.015*t)
def f3(t): return 5.0*cos(-0.03*t)*exp(0.015*t)
for t in range(-30, 74, 1):
rate(50)
grafico1.plot(t, f1(t))
grafico2.plot(t, f2(t))
grafico3.plot(t, f3(t))