Disegna una sequenza di tratti con x che scivola verso destra e y verso il basso
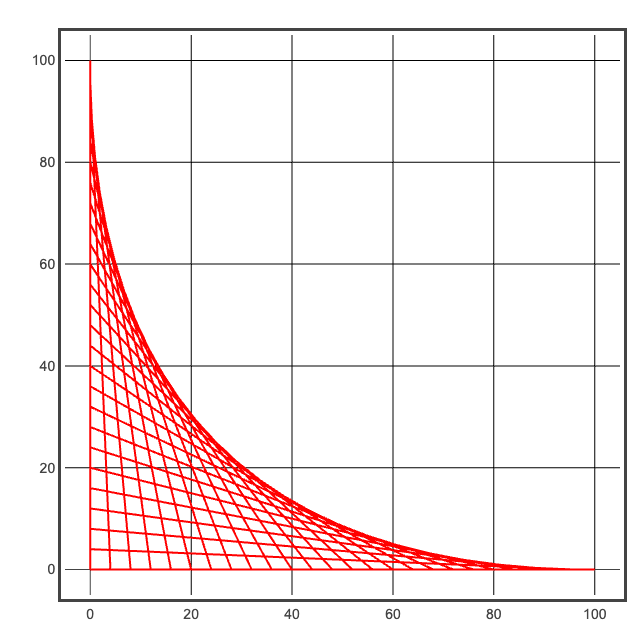
from vpython import *

DIM = 640          # DIMENSIONE FINESTRA
MAX = 100          # MASSIMA ASCISSA / ORDINATA
NUM = 25           # NUMERO TRATTI
SPAZIO = 5
MAX2 = MAX+SPAZIO

graph(fast=False, width=DIM, height=DIM,
      xmin=-SPAZIO, xmax=MAX2, ymin=-SPAZIO, ymax=MAX2)

DELTA = MAX/NUM    # PASSO COORDINATE
X = 0
Y = MAX
for i in range(NUM+1):
    rate(NUM)

    g=gcurve(color=color.red)
    g.plot(pos=(0,Y))
    g.plot(pos=(X,0))

    X += DELTA
    Y -= DELTA
La stessa (!) costruzione ma realizzata con una funzione che riceve come parametri i 3 punti ai vertici

from numpy   import linspace
from vpython import *

DIM    = 640
MAX    = 100
NUM    = 25
SPAZIO = 5
MAX2   = MAX+SPAZIO

graph(fast =False,
      width=DIM  , height=DIM ,
      xmin =-MAX2, xmax  =MAX2,
      ymin =-MAX2, ymax  =MAX2)

def string_art(p1, p2, p3):
    X12 = linspace(p1[0], p2[0], num=NUM, endpoint=True)
    X23 = linspace(p2[0], p3[0], num=NUM, endpoint=True)
    Y12 = linspace(p1[1], p2[1], num=NUM, endpoint=True)
    Y23 = linspace(p2[1], p3[1], num=NUM, endpoint=True)
    g = gcurve(color=color.red)
    for x12,y12,x23,y23 in zip(X12, Y12, X23, Y23):
        rate(NUM)
        g.plot(pos=(x12, y12))
        g.plot(pos=(x23, y23))
        g.plot(pos=(x12, y12))

A = ( 100, 100)
B = ( 100,-100)
C = (-100,-100)

string_art(A, B, C)
Esperimenti
Scegliendo opportunamente la terna di punti si possono realizzare figure interessanti

A = ( 100, 100)
B = ( 100,-100)
C = (-100,-100)
D = (-100, 100)

string_art(A, B, C)
string_art(B, C, D)

A = ( 100, 100)
B = ( 100,-100)
C = (-100,-100)
D = (-100, 100)

string_art(A, B, C)
string_art(B, C, D)
string_art(C, D, A)
string_art(D, A, B)
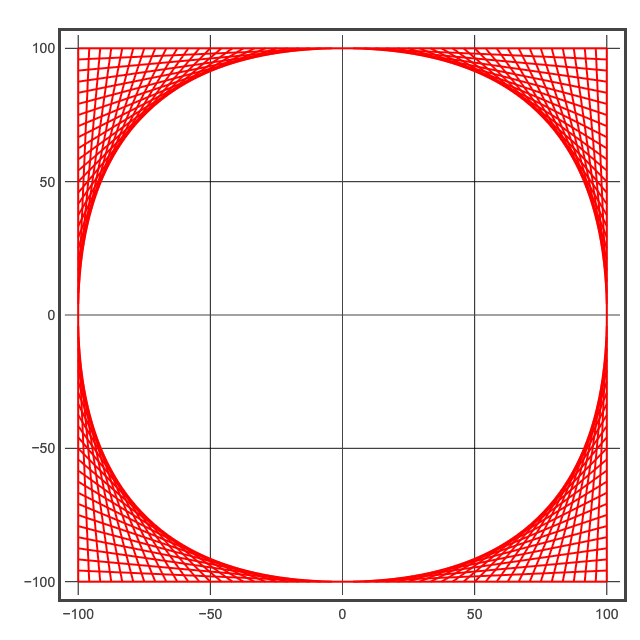
A = ( 100, 100)
B = ( 100,   0)
C = ( 100,-100)
D = (   0,-100)
E = (-100,-100)
F = (-100,   0)
G = (-100, 100)
H = (   0, 100)

string_art(H, A, B)
string_art(B, C, D)
string_art(D, E, F)
string_art(F, G, H)