La serie di Leibniz

def a(n): return ((-1)**n)/(2*n+1)

PASSI = 10
S_n   = 0
for n in range(PASSI):
    a_n   = a(n)
    S_n  += a_n
    pi_n  = 4*S_n

    print("%i | %13.10f | %12.10f | %12.10f" %(n, a_n, S_n, pi_n))
Output
0 |  1.0000000000 | 1.0000000000 | 4.0000000000
1 | -0.3333333333 | 0.6666666667 | 2.6666666667
2 |  0.2000000000 | 0.8666666667 | 3.4666666667
3 | -0.1428571429 | 0.7238095238 | 2.8952380952
4 |  0.1111111111 | 0.8349206349 | 3.3396825397
5 | -0.0909090909 | 0.7440115440 | 2.9760461760
6 |  0.0769230769 | 0.8209346209 | 3.2837384837
7 | -0.0666666667 | 0.7542679543 | 3.0170718171
8 |  0.0588235294 | 0.8130914837 | 3.2523659347
9 | -0.0526315789 | 0.7604599047 | 3.0418396189
matplotlib
import matplotlib.pyplot as plt
PASSI = 30
N = []
A = []
PI = []
def a(n): return ((-1)**n)/(2*n+1)
S_n = 0
for n in range(0,PASSI):
a_n = a(n)
S_n += a_n
pi_n = 4*S_n
print(n, a_n, S_n, pi_n)
N.append(n)
A.append(a_n)
PI.append(pi_n)
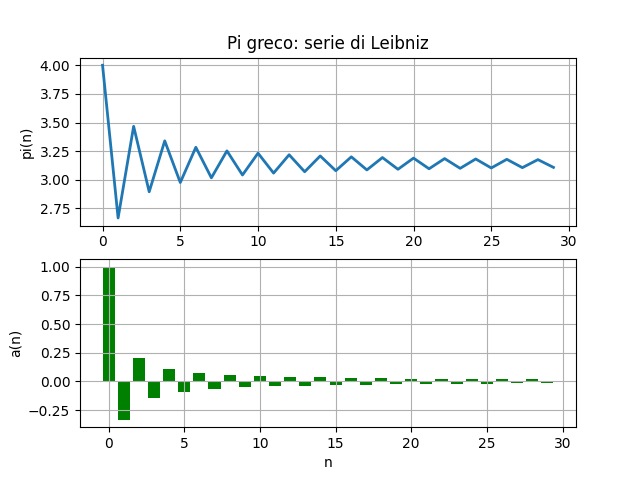
plt.subplot(2, 1, 1)
plt.grid()
plt.plot(N,PI, linewidth="2")
plt.title("Pi greco: serie di Leibniz")
plt.ylabel("pi(n)")
plt.subplot(2, 1, 2)
plt.bar(N,A, color="green")
plt.grid()
plt.xlabel("n")
plt.ylabel("a(n)")
plt.show()
fractions
Ottieni una successione di frazioni che converge a pigreco!
import fractions

PASSI=10

def a(n): return fractions.Fraction((-1)**n, 2*n+1)

S_n = fractions.Fraction(0, 1)
for n in range(PASSI):
    a_n   = a(n)
    S_n  += a_n
    pi_n  = 4*S_n
    print("%i | %5s | %17s | %17s | %12.10f" %(n, a_n, S_n, pi_n, float(pi_n)))
Output
0 |     1 |                 1 |                 4 | 4.0000000000
1 |  -1/3 |               2/3 |               8/3 | 2.6666666667
2 |   1/5 |             13/15 |             52/15 | 3.4666666667
3 |  -1/7 |            76/105 |           304/105 | 2.8952380952
4 |   1/9 |           263/315 |          1052/315 | 3.3396825397
5 | -1/11 |         2578/3465 |        10312/3465 | 2.9760461760
6 |  1/13 |       36979/45045 |      147916/45045 | 3.2837384837
7 | -1/15 |       33976/45045 |      135904/45045 | 3.0170718171
8 |  1/17 |     622637/765765 |    2490548/765765 | 3.2523659347
9 | -1/19 | 11064338/14549535 | 44257352/14549535 | 3.0418396189