Vedi la discussione.
import random

PUNTI = 5000
punti = 0

for p in range(PUNTI):
    x = random.random()
    y = random.random()
    if(x**2 + y**2 <= 1):
        punti += 1

rapporto = punti/PUNTI
pigreco  = 4*rapporto

print("PUNTI = %d, punti = %d, rapporto = %.4f, pi = %.4f" %(PUNTI, punti, rapporto, pigreco))
import matplotlib.pyplot as plt
import numpy as np # linspace()
import math # sqrt()
import random
PUNTI = 5000
punti = 0
def f(x): return math.sqrt(1-x**2)
xp = [] # ASCISSE CASUALI
yp = [] # ORDINATE CASUALI --- SOTTO IL GRAFICO
xP = [] # ASCISSE CASUALI
yP = [] # ORDINATE CASUALI --- SOPRA IL GRAFICO
for p in range(PUNTI):
x = random.random()
y = random.random()
if(x**2 + y**2 <= 1):
punti += 1
xp.append(x) # punto sotto
yp.append(y)
else:
xP.append(x) # punto sopra
yP.append(y)
pigreco = 4*punti/PUNTI
print("PUNTI = %d, punti = %d, pi = %.2f" %(PUNTI, punti, pigreco))
X = np.linspace(0,1)
yf = []
for x in X:
yf.append(f(x))
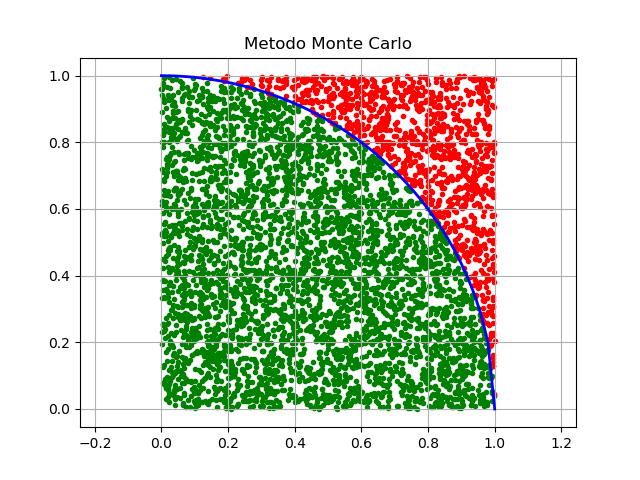
plt.axis("equal") # assi
plt.grid(which="major") # griglia
plt.plot(X, yf, color="blue", linewidth="2") # Funzione
plt.scatter(xp, yp, color="green", marker =".") # Sotto...
plt.scatter(xP, yP, color="red", marker =".") # Sopra...
plt.title("Metodo Monte Carlo")
plt.show()